Project Type - Compare Dates
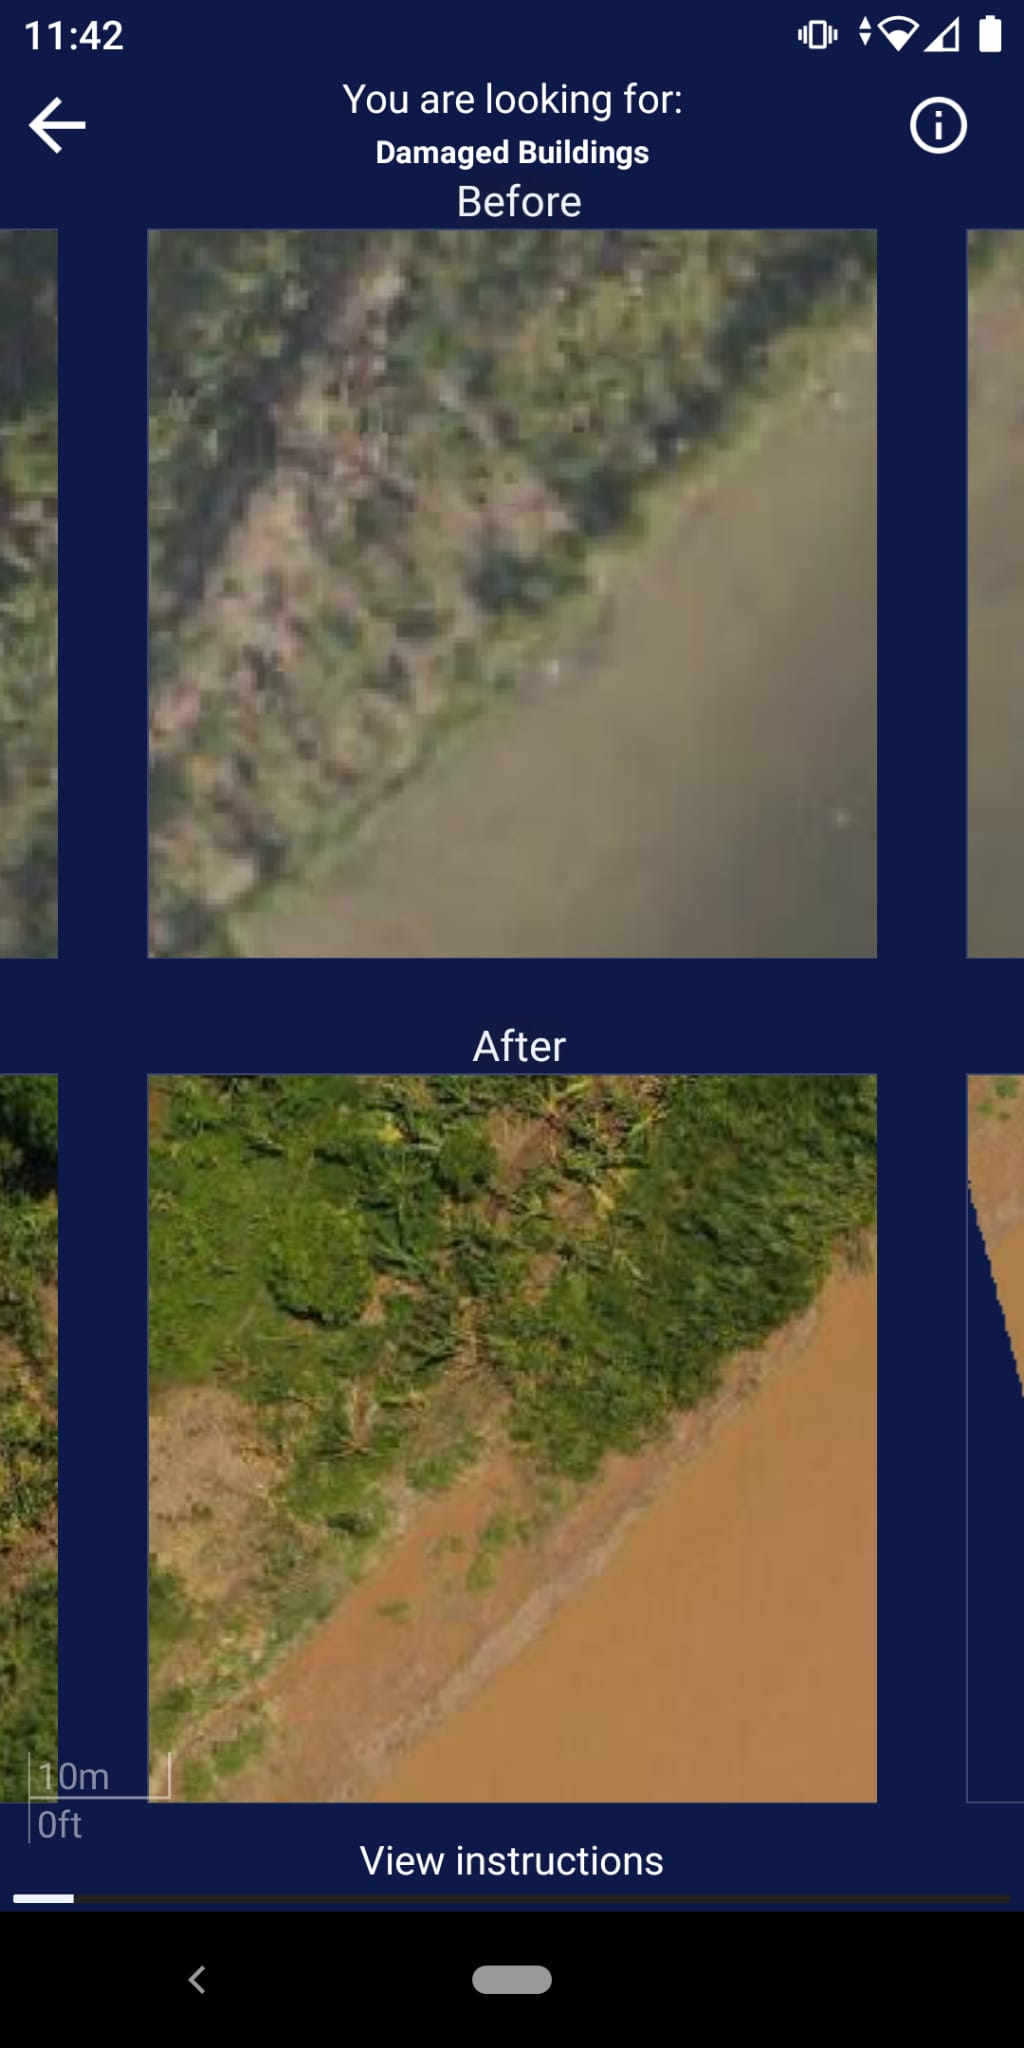
Two images are shown, the upper picture shows a scene before e.g. a disaster, while the lower picture shows the scene afterwards. By tapping you can classify the scene as yes, maybe or bad_imagery. Project managers can define which objects to look for, e.g. “buildings”. Furthermore, they can specify the tile server of the background satellite imagery, e.g. “bing” or a custom tile server.
Compare Dates projects have projectType = 3.
Project
The structure and creation steps follow the similar pattern of the Find Features project type. Projects can also be created via a HOT Tasking Manager Project ID.
In addition to the common project fields documented in the data model, Compare Dates projects carry the following project-type-specific fields:
| Parameter | Type | Description |
|---|---|---|
| zoomLevel | int | Web Mercator zoom level at which tiles are served. |
| tileServer | object | Raster tile server configuration for the “before” imagery (upper image) — includes a server name, url, credits, and optional apiKey. |
| tileServerB | object | Raster tile server configuration for the “after” imagery (lower image) — same shape as tileServer. |
Group
Compare Dates groups carry tile-map-service bounding-box tile coordinates on top of the common group fields:
| Parameter | Type | Description |
|---|---|---|
| xMax | int | Maximum tile-X coordinate covered by the group. |
| xMin | int | Minimum tile-X coordinate covered by the group. |
| yMax | int | Maximum tile-Y coordinate covered by the group. |
| yMin | int | Minimum tile-Y coordinate covered by the group. |
Task
| Parameter | Type | Description |
|---|---|---|
| taskX | int (optional) | The x coordinate characterises the longitudinal position of the tile in the overall tile map system taken the zoom level into account. The x coordinates increase from west to east starting at a longitude of -180 degrees. |
| taskY | int (optional) | The y coordinate characterises the latitudinal position of the tile in the overall tile map system taken the zoom level into account. The latitude is clipped to range from circa -85 to 85 degrees. The y coordinates increase from north to south starting at a latitude of around 85 degrees. |
| geometry | string | Each task has a polygon geometry, which can be generated by its x, y and z coordinates. At the equator the task geometry is a square with an edge length of around 150 metres covering circa 0.0225 square kilometres. Due to the web Mercator projector the task geometry will be clinched with increasing distance to the equator. At the same time the area per task will decrease. |
| url | string (optional) | Image for the tile at timestamp A. The tile URL points to the specific tile image described by the x, y, and z coordinates. |
| urlB | string (optional) | Image for the tile after timestamp A. The tile URL points to the specific tile image described by the x, y, and z coordinates. |
Result
Results follow the common result shape, with results: dict[str, int] keyed by taskId. Only the following classifications are stored:
| Value | Meaning |
|---|---|
1 | Yes |
2 | Maybe |
3 | Bad Imagery |
Whenever users indicate “No Change” by just swiping to the next task, no data entry is created.