Analysis of the MapSwipe Tiles — how “square” are they?
To generate VGI for humanitarian use, project areas are cut into tiles so that users can search for buildings on aerial imagery. The MapSwipe tiles are created as described by Bing using Level of Detail 18 (task_z = 18 for MapSwipe data). Users assign a Yes, No, Maybe, or Bad Imagery to each tile. This information is used to select positive tiles and create larger geometries representing a settlement layer. While these tiles look perfectly square (e.g. in a web map or in the MapSwipe mobile app), they do not represent the same area.
The web Mercator projection distorts the image in a way that objects further from the equator continuously appear larger than they are. So always keep in mind: the area represented by a tile gets smaller the further north or south the tile is located. Table 1 shows that projects further from the equator have smaller tile areas and shorter side lengths. The angles also deviate further from rectangular.
| 10836 Chad | 7605 Madagascar | |
|---|---|---|
| Geographical latitude | 21° North | 25° South |
| Average tile X length [m] | 144.9570 | 138.3959 |
| Average tile Y length [m] | 144.0854 | 137.6354 |
| Average area [m²] | 20,886.2967 | 19,048.1169 |
| Min area [m²] | 20,791.6519 | 18,921.4767 |
| Max area [m²] | 20,949.2044 | 19,139.2674 |
| Area range [m²] | 157.5525 | 217.7908 |
| Deviation from 90° angle | ~ 0.01171° | ~ 0.0063° |
Table 1: Measurements for MapSwipe tiles.
Figure 1 shows the decrease in tile size from south to north in project 10836 (Chad) on the northern hemisphere.
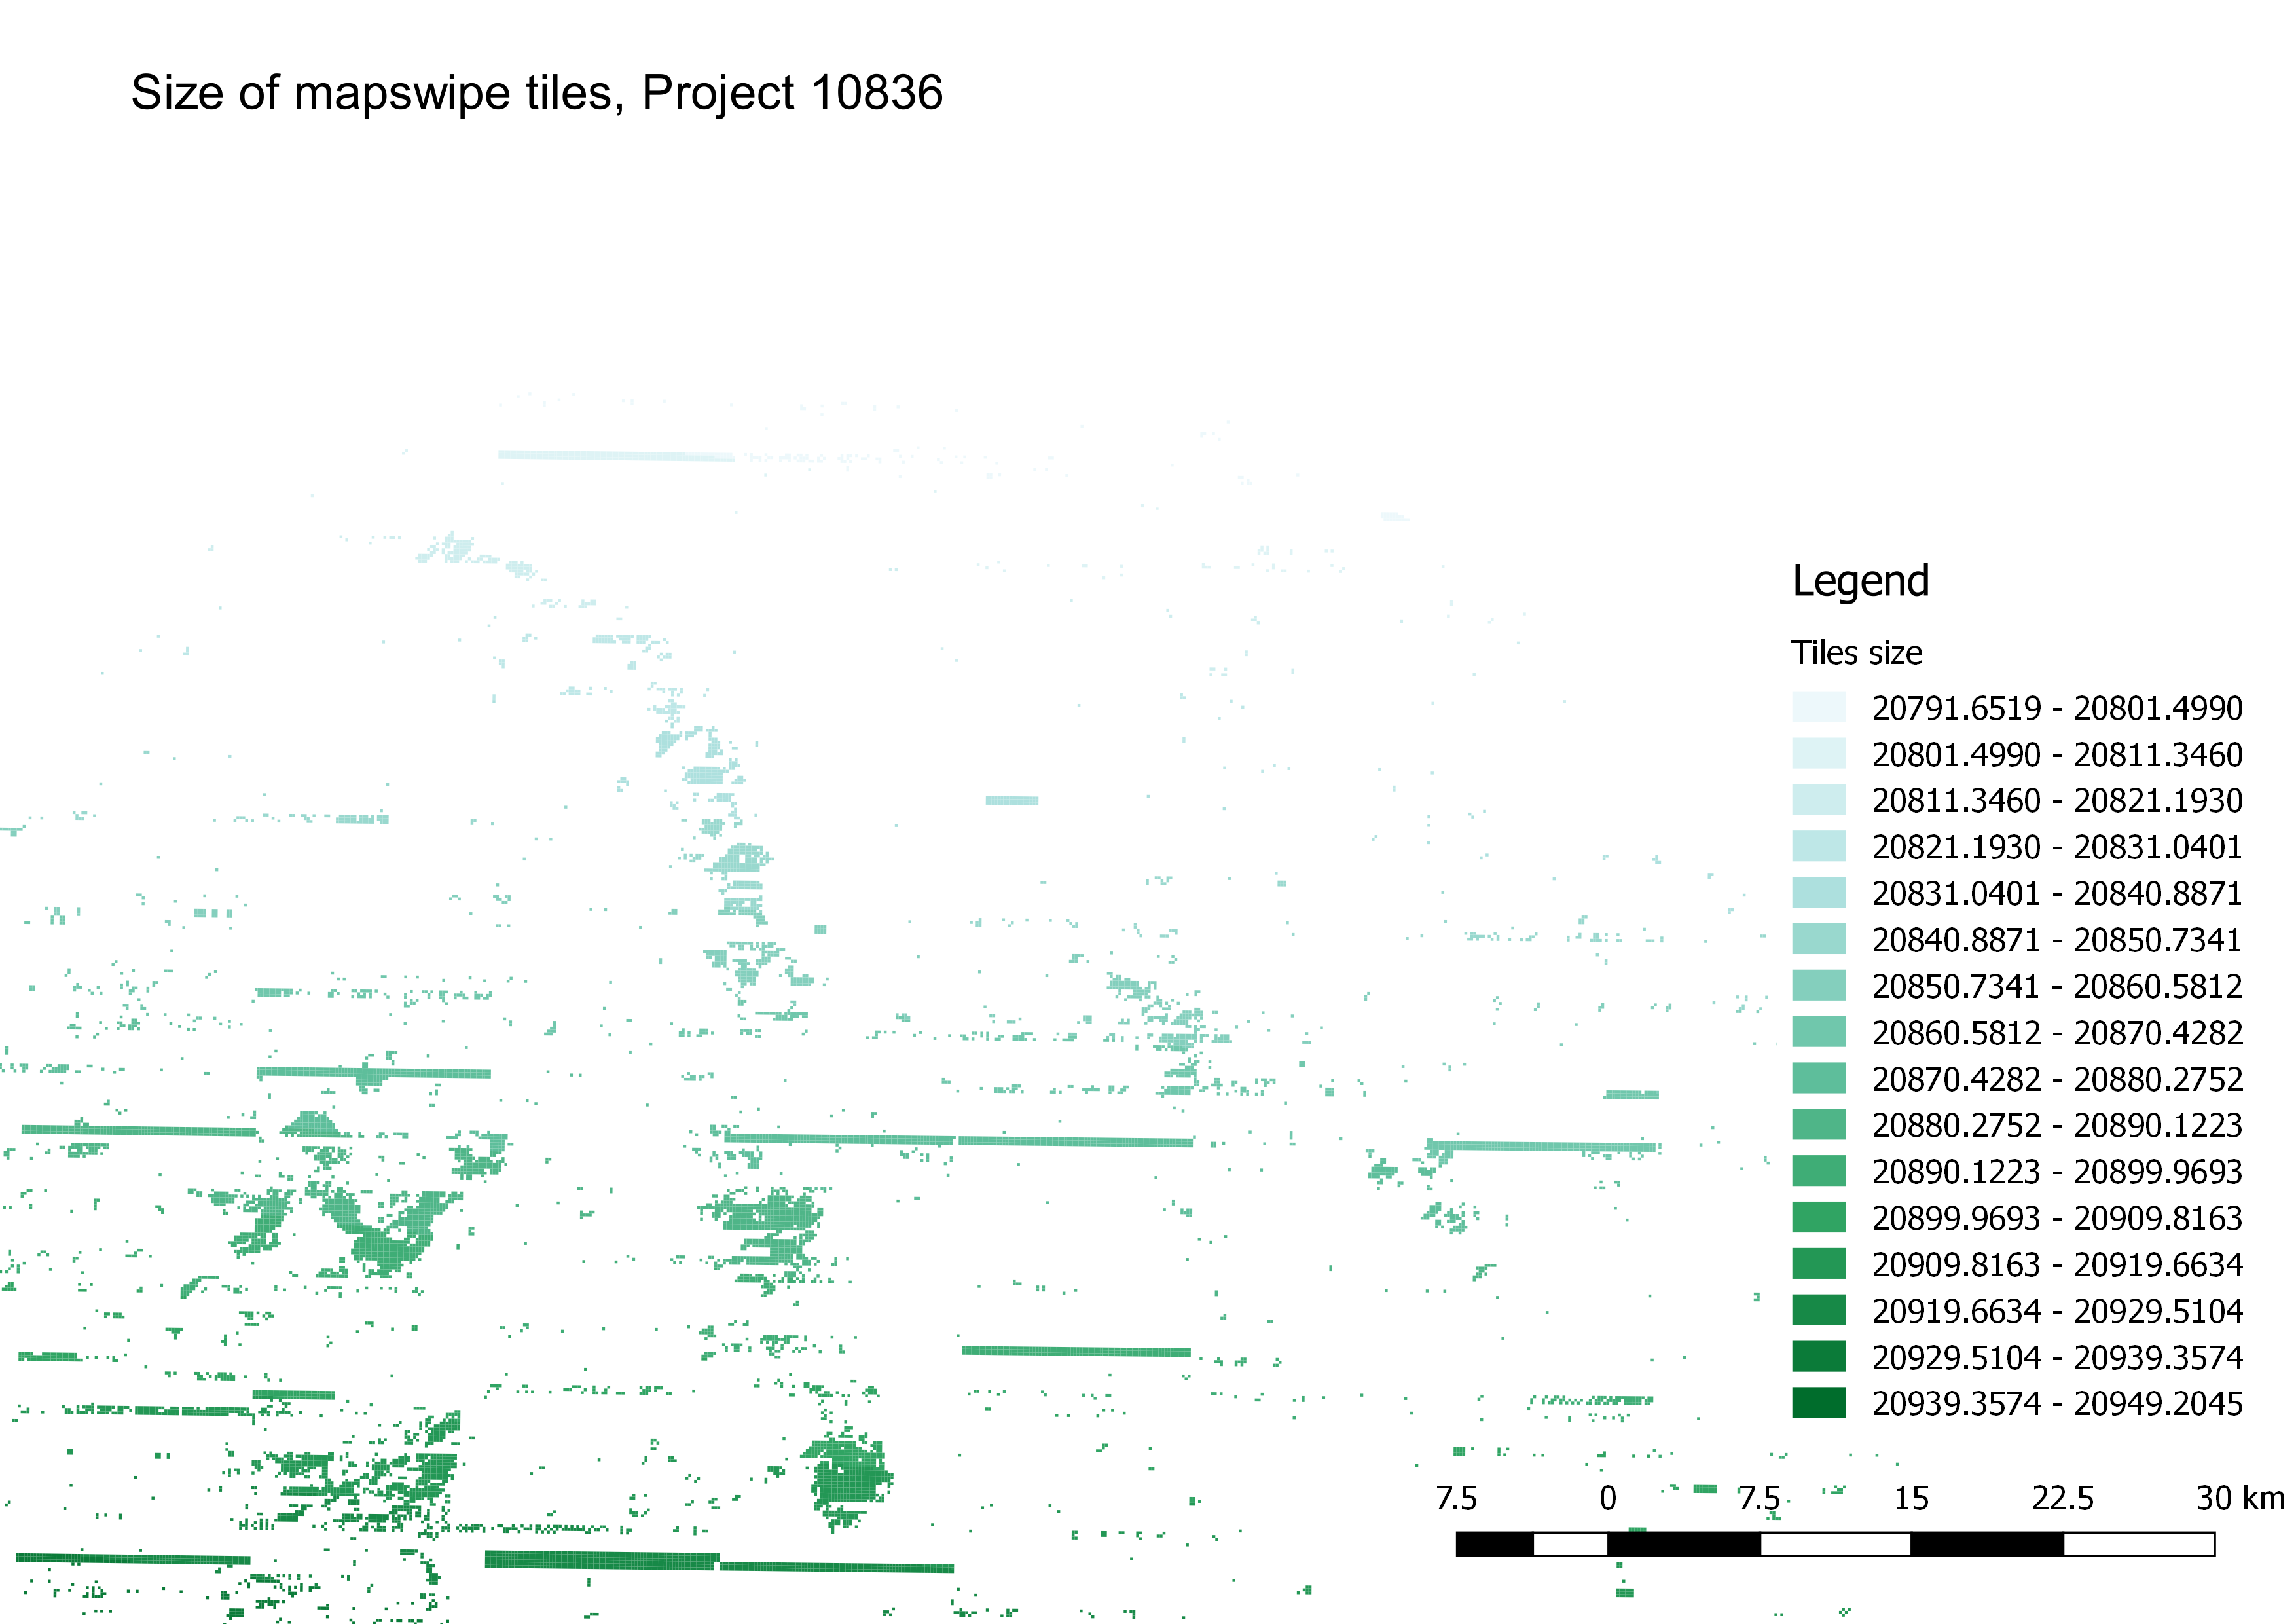
Figure 1: Area in m² of MapSwipe tiles in project 10836. Because the project is on the northern hemisphere, tiles further north are smaller.
In the MapSwipe app, each tile has a size of 256×256 pixels. The translation from pixels to meters depends on geographical latitude and the level of detail (see Figure 2).
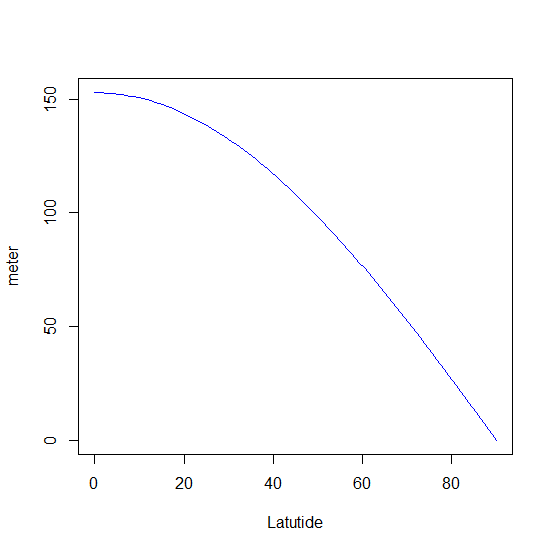
Figure 2: Tile length from pixel to meters: f(latitude, level) = (cos(latitude * pi/180) * 2 * pi * 6378137) / (256 * 2^level) * 256 for level = 18. Values range from 152.8741 m (Equator) to close to 0 m (poles).
As a result of the change in side length and inner angles, tile area decreases with distance from the equator as well — see Figure 3.
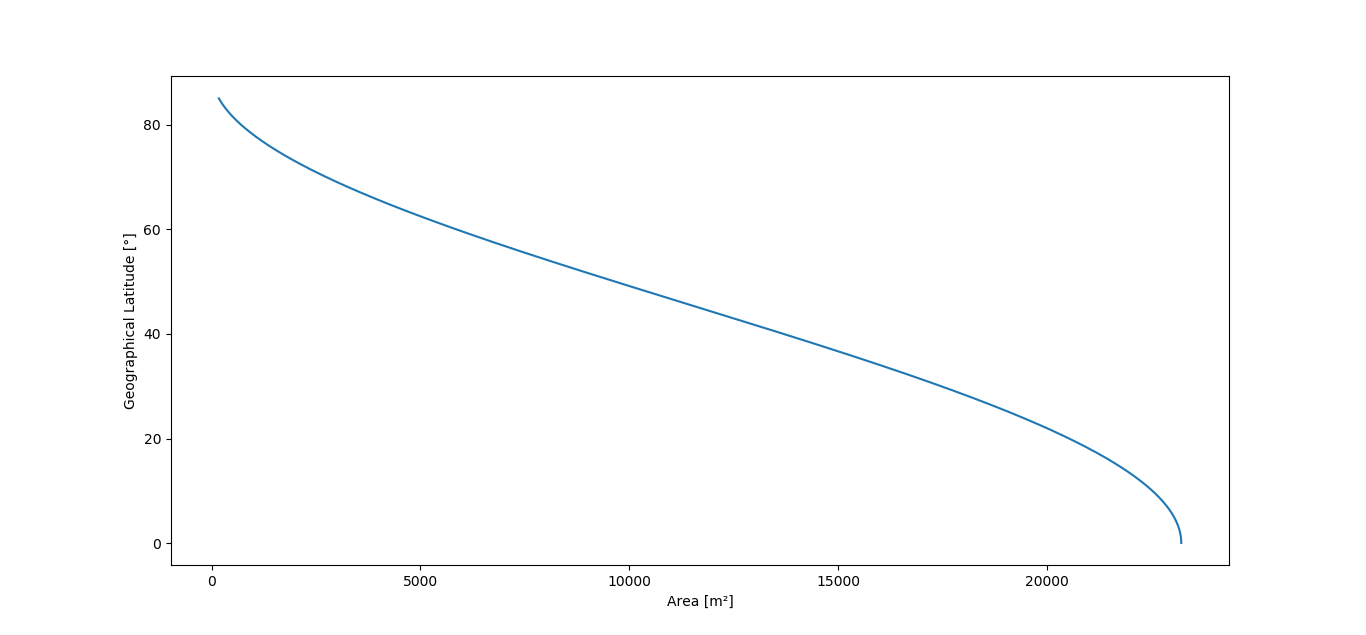
Figure 3: Calculated tile area for the standard level 18, from 90° to 0°.
Summary
- Area and side length of a tile continuously decrease with distance from the equator.
- Within one project, the differences in tile size depend on the north–south extent of the project.
- The tile shapes differ further from a true rectangle the further they are from the equator.
- A sample GeoJSON file with calculated area and side length per tile Y-coordinate is bundled with these docs — download it and load it in QGIS or any other GIS tool.