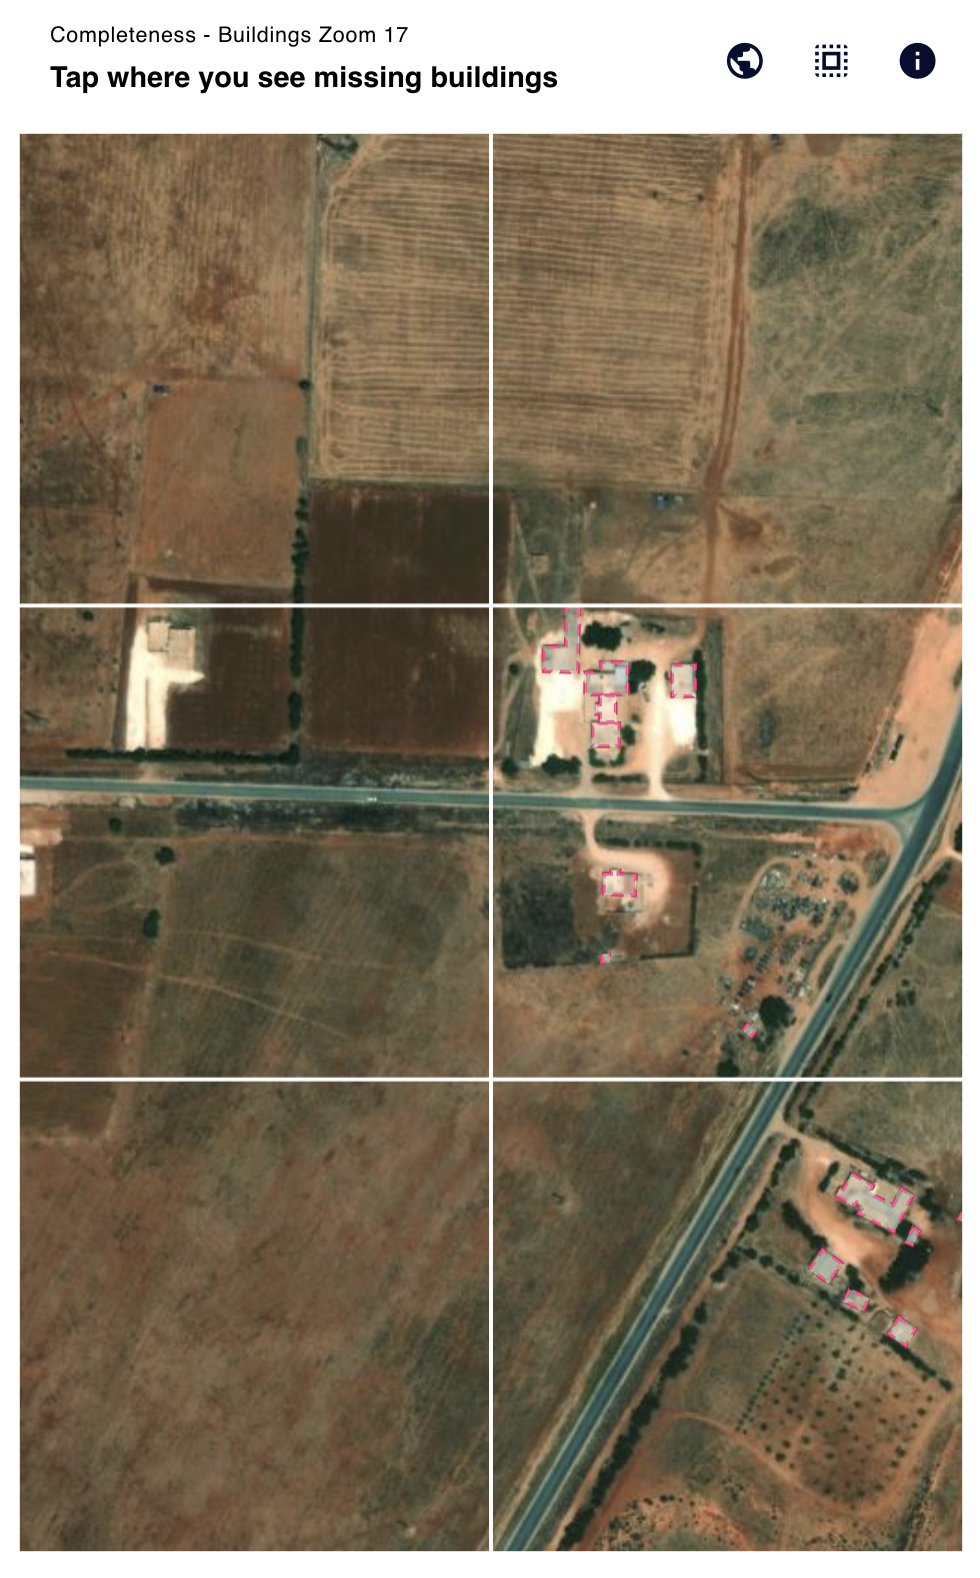
Project Type - Check Completeness
Similar to the Find Features project type but with an addition of an overlay raster or vector layer. Currently, MapSwipe mobile app only supports raster layer while MapSwipe4Web support both. You can call it a mix of Find Features and Validate Footprints in a nutshell.
To create a Check Completeness project, you need to add all information and upload a bounding polygon as well as fill in some information about your project.
Check Completeness projects have projectType = 4.
Project
The structure and creation steps follow the similar pattern of the Find Features project type.
In addition to the common project fields documented in the data model, Check Completeness projects carry the following project-type-specific fields:
| Parameter | Type | Description |
|---|---|---|
| zoomLevel | int | Web Mercator zoom level at which tiles are served. |
| tileServer | object | Raster tile server configuration for the base imagery — includes a server name, url, credits, and an optional apiKey. |
| tileServerB | object | Raster tile server configuration for the comparison imagery — same shape as tileServer. |
| overlayTileServer | object | Overlay layer drawn on top of the imagery (raster or vector — the mobile app currently supports raster, web supports both). |
Group
Check Completeness groups carry tile-map-service bounding-box tile coordinates on top of the common group fields:
| Parameter | Type | Description |
|---|---|---|
| xMax | int | Maximum tile-X coordinate covered by the group. |
| xMin | int | Minimum tile-X coordinate covered by the group. |
| yMax | int | Maximum tile-Y coordinate covered by the group. |
| yMin | int | Minimum tile-Y coordinate covered by the group. |
Task
Tasks are saved for tutorials, since their spatial information can be derived from the spatial extent of the corresponding group. Here, the tutorials are saved based on the project that it is derived from.
| Parameter | Type | Description |
|---|---|---|
| taskX | int | The x coordinate characterises the longitudinal position of the tile in the overall tile map system taken the zoom level into account. The x coordinates increase from west to east starting at a longitude of -180 degrees. |
| taskY | int | The y coordinate characterises the latitudinal position of the tile in the overall tile map system taken the zoom level into account. The latitude is clipped to range from circa -85 to 85 degrees. The y coordinates increase from north to south starting at a latitude of around 85 degrees. |
| geometry | string | Each task has a polygon geometry, which can be generated by its x, y and z coordinates. At the equator the task geometry is a square with an edge length of around 150 metres covering circa 0.0225 square kilometres. Due to the web Mercator projector the task geometry will be clinched with increasing distance to the equator. At the same time the area per task will decrease. |
| url | string | The tile URL points to the specific tile image described by the x, y, and z coordinates. Usually, the image has a resolution of 256 x 256 pixels. However, some providers also generate image tiles with higher resolution (e.g. 512 x 512 pixels). |
Result
Results follow the common result shape, with results: dict[str, int] keyed by taskId. Only the following classifications are stored:
| Value | Meaning |
|---|---|
1 | Yes |
2 | Maybe |
3 | Bad Imagery |
Whenever users indicates “No” by just swiping to the next set of tasks, no data entry is created. “No” classifications can only be modelled retrospectively for groups where a user also submitted at least one “Yes”, “Maybe” or “Bad Imagery” classification.